Contributors

Wednesday, May 23, 2012

Intro to Thunderstorms: Is there just one kind?

I would like to make a significant distinction between different types of thunderstorms. There is not just one single type. However, in order to simplify things for now, I will introduce two major forms of these storms: Air Mass Thunderstorms and Supercells.

So lets start with Airmass types. Airmass thunderstorms develop from an instability of the atmosphere that is typically caused by daytime heating. Yes, that's right, the SUN can cause these storms to fire up. They are very common in the southeast during the summer when the sun heats up the lower layers of the atmosphere, creating a buoyant environment where warm moist air near the surface wants to rise and the relatively cooler air above it wants to sink. As soon as the rising warm, moist air reaches the Lifting Condensation Level, marked by the level where the air becomes completely saturated, the cloud starts to form. The illustration below shows how a mature thunderstorm looks after it has developed.
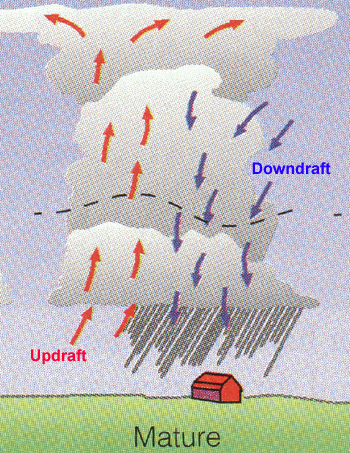
These upward motions will bring a lot of moisture into the upper levels of the atmosphere and eventually, so much moisture will accumulate that precipitation will develop and downdrafts form in the cloud, pushing the precipitation downward. In these areas, the precipitation is heaviest and strong winds are present. In fact the strong winds associated with these downdrafts are known as downbursts (gust fronts) and can easily exceed 40-50knots.

This is a simplified picture but even the more "complicated" picture is just an extension of this simple model. Below is a model of the three typical stages of these air mass storms. The first stage on the left comprises mainly all upward motion, developing the cloud but not precipitating. The middle stage is indicative of the picture above, with upward and downward motions in the cloud. This would be a mature thunderstorm. The final stage is when the downdraft is the only remaining motion and the storm is "emptying" the precipitation within it.
These storms do not last more than an hour and are though of as "suicidal". What feeds the growth of these storms is the continual supply of warm moist air from low levels. As soon as the downdraft forms, and precipitation starts, cooler air starts to fill up the lower levels and the storm's main fuel is cut off and it ceases to continue.

One other thing that has to be considered is that many storms are not just single cellular as in the cases above. Some systems involve multicells that consist of a combination of the 3 stages mentioned above.

Next, Supercells.

These are the major storms, that produce extreme hail and sometimes Tornadoes. They exist because of the same instability stated above, but also with the addition of something called wind shear, where wind at different levels of the atmosphere are at different speeds and move in different directions. The following image tries to show this feature
You can see elements of this system which are similar to that of air mass storms (gust front, downdrafts, updrafts, etc) but in supercells, the sheared environment is very conducive to forming vorticies and mesocyclones (easiest way to understand this is just consider smaller scale circulations) which are crucial for tornado formation (that can be for another blog post). The structure of these storms are quite impressive with extremely high cloud tops extending to the tropopause and often times overshooting the  troposphere boundary (depicted as the over shooting top) and long extensive anvils.

Supercells often form along a frontal boundary with considerable shear in the lower 300mb of the environment (1000 to 700mb layer) which is approximately 3km in height. Here are some photos of some of these storms in real life (these photos are not owned by me)


One of the other key features of these storms is the relative structure of precipitating regions and non-precipitating regions.

Out in front of the system, with the associated updraft, a downdraft will quickly form which is why the precipitation is focused towards the leading edge of the cloud base. Due to the shear mentioned before, any tornado that forms would likely occur "behind" the precipitation region, followed by an area of non-precipitating clouds called the flanking line, associated with another area of upward air motion.

These are some real basics on just two of the types of thunderstorm systems seen around the country (and world). I look forward to studying these more in graduate school and being apart of improving the forecasts of these storms.

Feel free to ask questions in the comment sections! I am by no means an expert in this topic but would welcome any questions you might have. I can always redirect you to someone or book who could help you more.


Monday, May 21, 2012

Late Spring Rain

After what felt like 6 weekends straight of dry and wonderful weather, mother nature decided it was time to end that streak as rain crept into Western Washington Sunday afternoon. But the real jolt of moisture came in this morning as a rather strong cold front for this time of year is pushing through as I type. There have been reports of rain all across the region, as can be seen from the latest radar image from Camano Island.


What was even more remarkable about this system was just how humid it was this morning. Dew points across the region were well into the 50s, with temps not too far off (Dew point temperatures are a measure of the amount of moisture in the air). The higher the dew points, the muggier it feels but we do not get dew points very high around here due to our close proximity to the cool Pacific Ocean. Areas around the gulf coast know muggy, with dew points regularly in the 60s and 70s due to the warm and very moist Gulf of Mexico which often times can stream up into the middle parts of the country. Here is the latest surface observations from around the region, with dewpoints in blue at each station.

This can also be seen from the vertical sounding at Quillayute on the Olympic peninsula(no idea how to spell that)

with a very moist environment from the surface up to 600mb, quite impressive with the large temperatures.

The latest time series from the University of Washington shows how the temperature and dewpoint have evolved over the last 72hrs,

With a sudden jump to near saturated Sunday afternoon.

All in all, what does this mean? Well this will be a rather wet Monday but the rain doesn't stop there. Shower threat will continue Tuesday through Thursday, dwindling as the weekend approaches. For now, looks like the weekend will be dry.


Friday, March 30, 2012

March Madness

(It's been a while since I have posted a blog. These past few months have been quite  busy with classes and school searches. For those of you who are less knowledgeable about my life, I am graduating UW in a couple months with my Bachelors and headed off to Texas Tech University to continue with my Masters degree and potentially PhD. I am very excited to continue learning about weather and I will probably be tailoring this blog to ALL things weather in the next few months and less on just the Northwest, although I will certainly keep up with NW happenings)

The madness I am referring to is not the feelings I get every time I look at my busted NCAA basketball bracket, but rather the large amount of precipitation that Sea-Tac airport has received this month.


The National Weather Service in Seattle posted this graphic this morning showing how this March rainfall compares to normal, to last year, and to the all time record of 8.40" (6.46" so far through the 29th this year, placing this March at 5th wettest in 67 years of records).

What does this all mean for the Northwest? Well most importantly in my opinion, is it loads up the ski resorts with POWDER! On a more economical level (and probably the real importance), it provides a large snow pack for our summer water supply. Here is an image of our current percentages compared to normal for snow water around the Western half of the country.


Many values well above 100% of normal for the upper Northwest into Montana but very low values for the Sierras in California and the Rockies in the inter-mountain West. Oregon, WA, Idaho should all be good for summer water supplies but California might fall into a major shortage should they not see any more snowfall in the Sierras.

Main cause of this weather pattern? A persistent upper level trough centered off the Washington coast, seen here in a NCEP reanalysis of Geopotential Height from March 18 to the 26th. This pattern brings SW flow into Washington, which means more moisture and a persistent flow for storm systems.

Do we expect this to change anytime soon? I would hope so, but I don't see it happening. The next image is a forecast for accumulated rainfall over the next 7 days...around 3-6" more around the northwest (could Sea-Tac get into the top 3 for most rainfall in March???).


Looks like Spring is going to be fruitful for the lawns and plants, but not for our sanity. ( I recently came back from a trip to Europe with temps in the 70's, maybe you should start making some vacation plans if you live in the Northwest :) )

Aaron

Sunday, November 20, 2011

November Hurricanes in the Northwest

Often over looked by major media outlets, fall and winter storms in the Northwest often pack a one-two punch of wind and rain in the lowlands (3 punches if you count snow in the mountains). Well this coming week, we have the potential for 4 storms in a 7 day span, all of which would bring breezy conditions (slightly less than windy conditions) and a large dose of rain for lowland locations. Here are a couple images I have taken off the University of Washington weather models that show the evolution of these low pressure systems

This first frontal system will move in Sunday night bringing gusty conditions to the coast and some breezy conditions inland. The black lines in the image are called isobars, lines of constant pressure. The closer those lines are, the stronger the winds. You can see the lines are packed close together along the coast which is where the strongest winds will be. The next storm....
Appears to be a bit stronger with a central pressure near 970mb by the Northern tip of Vancouver Island. This system moves in Monday evening and would bring winds between 15-30mph for the lowlands and gusts maybe to 45mph. Any remaining leaves on your trees would sure to be down by now. The next system moves in a few days later...
Thursday afternoon and evening. This low center is weaker than the previous one, 985 milibars, but would certainly bring a good amount of rain. Winds would be strongest along the coast during this scenario as well.

This final system of the week may be the most dynamical of the 4. What sets this one apart is the strong high pressure down south towards the central coast of California, just barely visible in this image. It's at about 1027 milibars and the low pressure center, in the Northwest corner of the image is around 970 milibars. Such a large difference in pressure, over a relatively small area can great a large pressure difference field, and since air tends to move from high to low pressure, the winds would accelerate very quickly between the high and low. This is why the isobars in this image span a very large area and are very packed together. Once this system moves in, it could be the windiest of the 4 system for the week.

In comparison, lets look at some images of hurricanes and these storms, known as mid-latitude cyclones.

Here is Hurricane Katrina
Yes, it's quite large and probably has very strong winds (I will get to that in a second).

Here is the Hanukkah Eve Storm that hit the Northwest in December of 2006,

I would beg that this storm is even larger, and has a much larger area of impact.

The best way to compare these systems is the central pressure though. The Saffir-Simpson Hurricane Scale details this

Now, Hurricane Katrina had a minimum central pressure of 902mb...we don't see those pressures with mid-latitude cyclones, it's even rare for tropical cyclones. But what I want you all to see is that NW storms can get into the 970's, even 960's on occasion. That would be on par with a Category 2 or 3 hurricane, but on a much larger scale (the larger scale also prevents MLC's to have stronger winds like Hurricanes have).

As you can see, we are in for a bumpy ride this coming week as these systems approach. I'll leave you with a couple images of the rainfall that will hit us.
This the 24hr accumulated precip ending Tuesday afternoon. The black is between 2.5 and 5" of rain...yikes. The red is between 5 and 10", localized over the central cascades near Oregon. Here is the snowfall at the same time...
Climbing up above 2 feet in some areas!!
This the rainfall ending Saturday afternoon...5-10" possible for the Olympics.

More snowfall for the Northern Cascades.

Flooding will be a major concern this week with lots of rain and rising rivers that won't have a lot of time to recede.

Meteorologically Yours,

Aaron

Sunday, November 13, 2011

"S" Word Update

I have already encountered some questions about whether we will see some snow this week. For an update, the models have not favored a scenario for snow around the Pac NW. Over the past 3 model runs, specifically the UW WRF (Weather Research Forecasting) model has 'warmed' temperatures up just enough on Thursday and Friday that any moisture around would probably fall as rain first...and maybe a heavier shower could see some wet snow mixed in.

First off, there is no terrifically organized system moving in with the cold so the moisture maker is limited. Pockets of showers could be expected but once again, those would be limited and sparse. Not to mention, hard to predict exact locations. One brighter side to this is that a Puget Sound Convergence Zone could set up once the upper level trough moves through which could enhance precip and bring down the snow level in localized locations.

Will continue updates through the week as more information can be gathered.

Friday, November 11, 2011

Inkling for Some Fluffy Stuff?

Around the Northwest, the mere mention of the "s" word can bring about a panic only one can experience to understand. Well this time of year, snow becomes a popular topic around communities as people become anxious for cooler weather and just the possibility of not having to go to the mountains to play in the terrific white fluff. In addition, snow becomes a popular topic among meteorologists because weather models begin to turn from the summer time calmness (around the Pacific Northwest) to the stormy fall weather and the hint of colder winter temperatures. Sometimes, the two even come together. ;)

The issue with predicting snow around the Northwest, is that it's hard to get snow. The Pacific Ocean strongly mediates the air temperature here near the coast so it takes VERY cold air temperatures to overcome that heating and get snow.

The next hardest part about forecasting snow, arguably the hardest part, is that forecast models ARE NOT PERFECT! As meteorologists we learn about the atmosphere and it's motions, and these models predict those motions. Well that's a pretty tall task to ask of the models. I learned from my professor at the University of Washington, Cliff Mass, a good picture of how to understand model variability. It looks something like this:

Imagine a ski resort. You have 5 runs that all start at the top of the mountain and go down the mountain in different directions. Now think of each run as a forecast and going down the mountain as going farther out in time for the forecast (this will stretch your thinking a little). Here is a rough picture of my illustration


Now at the bottom of the mountain, the forecasts (runs) are all at different spots. As you go farther up the mountain, closer to the forecast time, the forecasts become closer and closer together until you get to the top, where they become relatively similar and agreeable.

Well in forecasting snow, sometimes models will paint a snow forecast 7 days out, lets say the Green line. You notice how the green line doesn't start and end at the same point along a vertical axis, so it may say snow 7 days out and rain the day before the forecast time. It's a very risky business to trust models 7 days out from a forecast time.

Models have gotten better over the years though. 2 decades these models were just getting started and you might not have been able to trust a forecast 2 or 3 days out. Now, 5 days is reasonable for trusting, although exact details (amount of snow, rain, winds, etc.) shouldn't be taken from a 5 day forecast.

Now to what I really wanted to talk about, but I felt I should give some grounds for my feelings about this. The model run by UW this morning painted a "favorable" picture for snow next Thursday and Friday. It would be a classic Pac NW scenario for snow, which I will get back to in a minute. Here are a couple images that the model outputs


I'll start with the upper level pattern of the atmosphere, at 500hpa pressure. Those pink colors, those are very cold temperatures associated with a trough of low pressure digging south from the Canadian continent. This is an important factor because air coming off the ocean is not very cold, but from the Canadian land, it would be VERY cold.


The next thing that is needed is a low pressure developing at the surface, which is clearly visible here. The low is centered right off Vancouver Island, bringing moisture and "pulling" the cold air at the surface towards it. Air tends to accelerate from High to Low pressure. This forecast is for 147hrs (from this morning at 4am). Here is the forecast for 171 hrs.


The low is centered right over Washington, pulling cold air right into Western Washington. The white color indicates temperatures near 0 degrees celsius.


Here is estimated snowfall for a 3 hour period ending Friday afternoon. This shows some snowfall around South Puget sound and the Eastside. Another 3 hours later...

 Some snow in Northern Western Washington. And here is the 24hr accumulated snowfall totals...


As expected the Eastern foothills would see more accumulation, and only a slight amount around the lowlands.

However, all of this forecast for the end of next week should be taken as a grain of salt, as I noted previously. It's just TOO EARLY to tell.

I felt this would be a good opportunity to explain this aspect of forecasting too far out, while also arousing your interest in some possible snow :) Because I'm sure excited

You can follow me on twitter for even more up to date information regarding Pac NW weather and even weather throughout the nation: @huskyAaron
OR visit my Facebook page: Aaron Hill Weather

I will post updates to this story as I get them :)

Cheers!

Sunday, October 2, 2011

Fall is Upon Us

What reminds you of fall? The leaves changing colors...school begins...days begin to get darker earlier. Well for me, it's superb low pressure systems coming in off the pacific. Yes, I'm a nerd. Latest Infrared Satellite imagery shows a well defined low off the Washington coast, which will push in a front overnight tonight with associated rain. 
The latest radar image from the Langley Hill radar (yes, that's the new one on the coast) shows the rain has already begun advancing inland. Just a quick note, the Camano Island radar is still down for the new Dual Pol radar update. Should be back up and running in a week or so.


The general atmospheric circulation pattern is set up to allow some strong lows to move by the coast tonight and Tuesday night. Below is an image of the large trough extending down the West Coast.


The trough will persist through Wednesday...
\
As we see a new system move in Tuesday night. Here is the forecast for 3hr precipitation Tuesday night around 8pm. Plenty of moisture down the West Coast, with Southern Oregon getting hammered with rain.


You can also see a nice cut off low over the area which will enhance the Southerly flow and keep things fairly mild. By Friday, a ridge builds in which should dry us off quite nicely.


Fall is here so expect the rain to continue for the next....well 3 months. :) Normal high temperatures around this time of the year are the mid 60s. Tuesday and Wednesday highs will be in the upper 50s, and temps will climb to the mid 60s by Friday.

Thursday, September 22, 2011

Coastal Radar

The new coastal radar is here! AND IT'S OPERATIONAL! Beginning yesterday the data from the new coastal radar, just north of Hoquiam, was being streamed to the outside world. You can see the long range images at the
National Weather Service Seattle office site,

National Weather Service

You can see the radar picks up on echoes well out over the Pacific and stretching out towards Vancouver Island (frontal band that will break down by today). This is an incredible day for Western Washington weather technology as state legislature and Professors from the University of Washington have been fighting for this radar for over a decade. This radar will be a crucial piece of understanding the structure of storms coming in from the Pacific. It is equipped with the new Dual Polarization technology that will help detect the types of particles (ice, snow, rain, heavy rain, hail, etc.) that are in the clouds. The Camano Island radar will now be shut down for 10-14 days as it also will receive this new technology. Washington will be the first state in the US will all of their radars fully operational with Dual Pol technology.

Have a great day! Will have a brief post soon about some actual weather :)

Wednesday, September 14, 2011

Top 50 Amateur Blogs

Recently I received an email regarding some of the best amateur meteorology blogs out on the web. Somehow, by some miracle, I made the top 50. I feel it is my duty to not only make you aware of the recognition but also share with you some of the other weather blogs out there that are in my opinion, quite fantastic. I have not looked at all of these, and I don't think I know any of the authors but I have followed a few and these guys sure do know what they are talking about. Here is the website so you can take a look at the top 50 Amateur Meteorology Blogs

http://www.associatedegreeonline.net/amateur-meteorology

Oh and by the way, I will be heading back up to the Northwest in the next week so expect some upcoming blogs about the weather. Seeing as I've been in Southern California for the summer, It has been a bit difficult to keep up on Northwest Weather. I will certainly get back to it once school kicks back up :)

Wednesday, August 31, 2011

Tropical Cyclones!

In the wake of Hurricane Irene, we have two new developments in the tropics. The National Hurricane Center has indicated an area of interest just east of the Yucatan Peninsula, noted here with the orange hashing
 They indicate it has a 30% chance of becoming a tropical cyclone but both the European model and GFS model that i have looked at indicate it's development into a tropical depression or a tropical storm over the next couple of days.

The reason I would favor this idea is because of the gulf of mexico. Tropical cyclones feed off of warm ocean waters and the gulf is a prime location for storms for this reason. This tropical wave depicted above is projected to move into the gulf where i suspect it to feed into those waters and develop. It may not become a hurricane but it will certainly produce rain for the upcoming weekend so people making plans for Labor Day around the gulf need to heed to warnings or watches about this storm.


2ND STORM: Tropical Storm Katia is now in the Central Atlantic with 60knots sustained winds. Conditions are favorable for Katia to develop into a strong Hurricane but it's threat to land is still uncertain. Models at the moment have trended for Katia to continue towards the east coast but then turn Northwest and Northward over the next week or so.

The reasoning for Katia to turn like that is the upper level patters of the atmosphere. The mid latitude jetstream can have a profound impact on these tropical storms, almost "steering" them northward. It looks like a trough that moves over the east coast kind of pulls the storm northward and it joins into the mid latitudes. This would be good thing for the east coast after they got pounded with heavy rains and subsequent flooding from Irene.

I'll have another update on the tropics in a day or so, I hope

On a side note, I was shown an article by FOX news the other day about how the US doesn't need a National Weather Service anymore and that private forecasting companies and media like The Weather Channel are far better at forecasting than the NWS. This is preposterous on so many levels, most importantly, where do those private companies and the media get their information? Oh yeah, the NWS, who runs the models and talks about conditions hourly. I can't believe FOX even allowed this opinion article to be published. Pathetic

http://www.foxnews.com/opinion/2011/08/27/do-really-need-national-weather-service/

Have a great work week!

Friday, August 12, 2011

Will a La Nina Winter Return?

La Nina La Nina, oh where art thou La Nina. While many people would have hoped La Nina was in our rear view mirror, after experiencing a dismal winter and an even worse Spring, it looks like we won't be able to drive fast enough away from her. The Climate Prediction Center is the major government body in the US that predicts our ENSO cycle (El Nino Southern Oscillation) and they have just recently posted a La Nina watch for this upcoming winter. So if you didn't enjoy this past winter or Spring, you may consider taking a nice long trip to Mexico for a break or two.

For those of you who would like to know a little more about La Nina, read on

La Nina is declared when the Sea Surface Temperature in the Central and Eastern Pacific averages .5 degrees Celcius below normal for 3 consecutive 3 month intervals. Here is a graphic that I hope explains this more.
This graphic shows the last La Nina we went through this Winter and Spring. The declaration of a La Nina occurs with temperatures taken from the 3.4 region shown in the 2nd box above. I'm not sure why it has to be this region but I know it is.
These are the regions here with the 1+2 box nearest the South American Continent.


You can see in June and into July we we starting to just average positive sea temperatures and now in August we have retreated back to negative anomalies. Model projections that are run by the Climate Prediction Center as well as many other agencies around the world are beginning to show the return of La Nina this winter or we enter into a Neutral phase, between El Nino and La Nina.

The average of these model runs is shows to hover near neutral conditions and not "double-dip" to La Nina. But if current conditions continue, I wouldn't be surprised to see the average of these models continue to inch closer to La Nina conditions. The CPC's own model is also run numerous times.


Their's clearly shows a double-dip La Nina scenario predicted.

While this last winter wasn't the Snowmaggedon projected by many media outlets, La Nina winters do typically give Washington cooler and wetter weather patterns. I will be anxious to see what the next outlook says.

(How La Nina forms: Trade winds in the tropics move from the east to the west, contrary to here in the mid latitude areas where the winds move from West to East. During a La Nina episode these trade winds are strong and move warm ocean waters on the surface of the Pacific to the West. This brings upwelling to the eastern Pacific (cool, deep ocean water moves up) and this is why we register colder sea surface temperatures. The atmosphere and it's circulations are affected by this surface temperature movement in a variety of different ways and current research is still being done today on how these changes affect weather in Washington and all along the West Coast. It is a challenging research area since the period of oscillations are so large and we have only approximately 60 years of La Nina/El Nino records)


Tuesday, August 9, 2011

Summer Rain

I just took a look at the Global Forecast Model that the National Center for Environmental Prediction runs and it doesn't look too good for the Northwest over the coming week. Two upper level lows, associated with clouds, rain, and cooler weather will be making their way into the Northwest, with their eyes set on Washington.

It looks like clouds will dominate Wednesday and Thursday and there is a decent chance of rain for the beginning part of next week.

Just a short quick forecast tonight

Thursday, August 4, 2011

Summer in the Northwest!

For the past two weeks or so, it seems as if the Northwest has grown out of it's cool Spring and jumped right into a decent summer. Being down here in Southern California I haven't checked out any of the weather up there lately but I did this morning.

It looks like the upper levels of the atmosphere over the next couple of days will be "weak". What I mean by that is the airflow will not be as strong at the 500mb pressure level and  there doesn't appear to be any trough (cooler and wetter) or ridge (warm and sunny) that parks itself over the area.

This is a typical summertime phenomenon as it means there is a weak onshore push in the mornings and the afternoon heating of the atmosphere will clear out the clouds for a partly sunny or mostly sunny afternoon.

That's why the forecast for the next week calls for highs in the mid to upper 70s for almost 7 days straight. Almost unheard of for the Northwest. I haven't looked at longer range models (out 15 days) but I wouldn't be surprised to see this pattern continue.

Enjoy the sunny weather up there Pacific Northwesterns! And remember, If it's sunny there, it's always a little more sunny down here in So Cal. ;)

I'll have another blog in a few days detailing some local California weather and what I'm learning at the National Weather Service

Monday, August 1, 2011

Next Tropical Storm?

UPDATED AUGUST 4th 10:00 AM PST

TS Emily is now located just South of the Dominican Republic moving WNW at 5mph, quite slow. The updated projected path still takes it just East of Florida but with now direct impact on the state. Still, rain and wind will most likely affect the peninsula and the Keys with Tropical Storm force.


UPDATED AUGUST 3rd 2:00PM PST

I have just looked at some of the more recent forecasts and it looks like Florida will be glanced by the storm. It is now officially Tropical Storm Emily and is located just Southwest of Puerto Rico. A recent radar image from Puerto Rico shows just part of the storm


Heavy rain, wind, and possible flooding will accompany the storm as it is crossing over the Caribbean islands. It's current forecasted track will take it just east of Florida but will still likely impact the state with rain and wind.


It appears likely that it will not intensify into a Hurricane by morning Saturday, where it is just east of the Florida coast. Will update on any more notices

--------------------------------------------------------------------


Current satellite images show a tropical "wave" in the western Atlantic near the Northern Windward Islands and Leeward Islands.
The National Hurricane Center has given it a 90% chance for tropical cyclone development over the next 48 hours. This could mean very short notice for Tropical Storm warnings in the Caribbean group of islands. GFS model runs done last night bring the low pressure system just East of Florida by August 6th, 6 days out

 But another model run, the ECMWF (dont worry about what the letters mean) showed almost no development by day 6 and the storm dissapating. There is plenty of uncertainty with the storm as the model run done around midnight PST last night (06Z) showed this
With the low WELL off the coast and not a threat to the US coastline.

At the moment, with no surface circulation, the tropical wave is not a depression but is likely to form into one with favorable atmospheric conditions over the next 48 hours. Air Force Hurricane Hunters will monitor the progression of the storm for the next several days.

Updates to Follow

Thursday, July 28, 2011

Tropical Storm Don

The first major storm threatening the US coast is upon us as Tropical Storm Don is nearing the Texas Southeast coastline. In about 36 hours it will make landfall as most likely a tropical storm, strengthening just slightly from its current state. Continued vertical shear and interaction with some dry air will prevent the storm from intensifying much further. Here is the projected path of the storm
You can see there are tropical storm warnings up for the Texas coastline and also a tropical storm WATCH for the extreme southern tip of the TX coast.

Wind speeds right now of tropical storm force encompass a small circular area in the gulf and projected wind speeds for the storm are as follows
Probability of tropical storm force winds are shown here with the light brown indicating 60 to 70 percent and the darker brown (hitting the coastline) 50-60%.

With a strong ridge set up over the middle of the country, and models projecting it to be stationary for the next 36-48 hours, I would expect the storm to follow this Northwesterly path up until landfall and just a little afterward before shifting Northward and Northeast a few days from now.

With the big drought occuring right now in Texas, this rain will be welcomed by many. I will post updates on Twitter as needed. @huskyAaron